
The Accuracy of TGA as Tools in Measuring the Percentage of Filler Loading in Polymers
Authors : MOHD HANIF KASA@ABDUL GHANI & AHMAD ZAFIR ROMLI
| TGA (Thermogravimetric Analyzer) is one of the most common tools in measuring the percentage of filler in polymers. The simple setup couple with a very small amount of sample required make it the method of preference. But before we go further, let us recap the fundamental of the TGA. Basically the TGA consist of a micro balance coupled with the sample holder that was placed in a furnace (various temperature ranges depending on the TGA system). During the test, the furnace will be heated at a pre-determined heating rate to the desired end temperature (beyond the degradation temperature of the mate-rial to be analyzed). The sample required usually within the range of 5 – 10 mg and some system able to accept up to 20 mg either solid or liquid form. Now the question – Can we analyze the filled polymer sample? The answer is YES, but how accurate is the result? That will be discussed further in this article. Most of the polymer products avail-able are filled with fillers as to feed various purposes such as cost reduction, mechanical properties enhancement, physical properties enhancement and others. Therefore, it is critical to know the amount of filler being added into the polymer especially for quality control of product or for the purpose of reverse engineering. In order to study this, a simple experiment was setup by using unsaturated polyester as the matrix and CaCO3 as filler at 10%, 30% and 50% w/w accordingly. Both materials are mixed using a mechanical stirrer for 4 minutes before methyl ether ketone peroxide (MEKP) was added and stir for another 4 minutes and poured into a mould of 200mm length X 200mm width X 10mm thickness. The sample was left at room temperature for 24 hours before demoulding and post cured for another 24 hours at 70°C in an air circulated oven. |
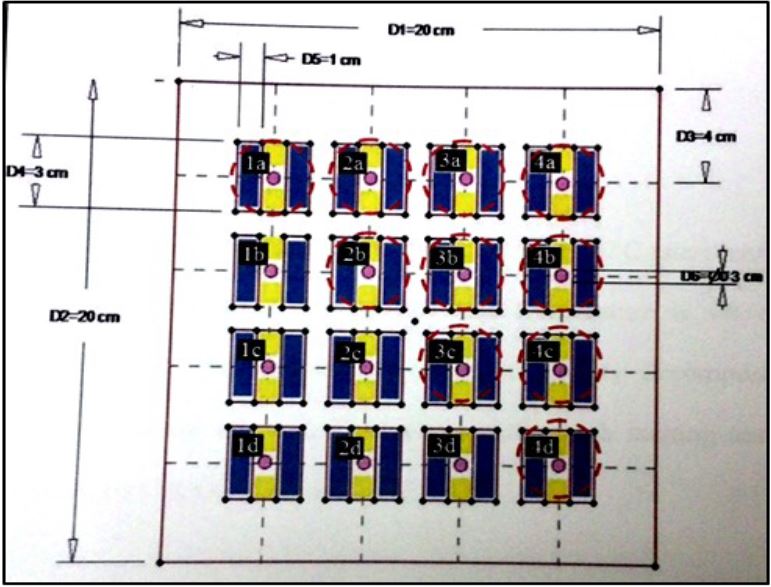
Figure 1: The schematic diagram of the CaCO3 filled |
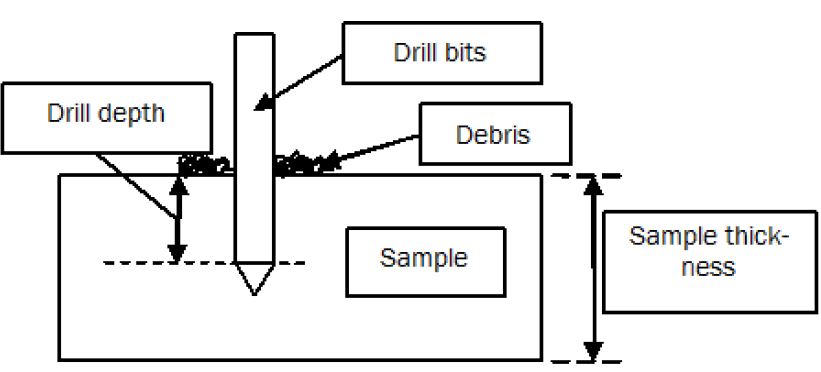
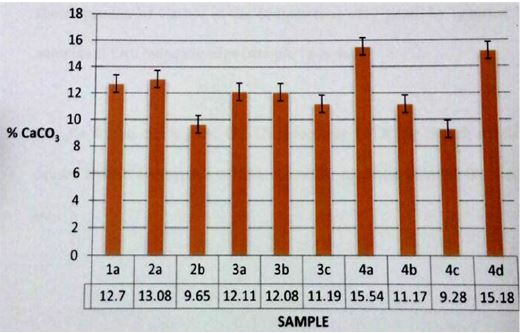
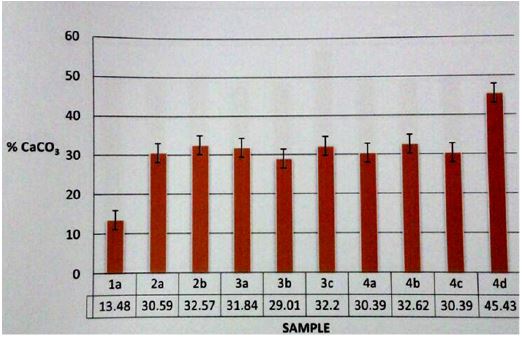
| The schematic diagram and the labelling of the samples are as shown in Figure 1 where the pink coloured dot is the location of sampling for the TGA analysis. Referring to Figure 1, the sampling was taken at various places as to indicate the relevancy of the location of the sampling for the TGA analysis. As to ensure homogeneity of the samples to be taken, drilling method was used where the sample taken is at the center and not on the surface as shown in Figure 2. The debris will be taken and weight accordingly prior to the TGA tests. For the TGA test, the test will be carried out at 10 °C/min and stop at 600 °C. The result obtained are as shown in Figure 3, 4 and 5. Looking at Figure 3, the scattered trend of the histogram showing the variability of the result obtains ranging from about 9% up to 15% of CaCO3 being detected. The variability in the results obtain are most probably due to the uneven mixing of the CaCO3. It seems that the filler is much harder to evenly mix at a lower percentage compared to at a higher percentage as shown in Figure 4 and 5. The graph shown in Figure 4 and 5 indicates a stable mass of filler being detected and the amount shown are the same as the amount of filler being incorporated in the polymer during mixing.As the conclusion by looking at the results – Is it possible for the TGA to accurately measure the percentage of filler loading in polymers? The answer is YES and NO. The YES answer is at high filler loading and NO is when the low filler loading in polymer in this case at 10%. It is, however debatable where one can argue about the effectiveness of the mixing method. In whatever case, we can say that the lesser the percentage of filler in the polymer the higher the possibility of having uneven mixing. In additional to that, one has to take note that even mixing does not mean that good dispersion of the fillers will be obtained. We might have even mixing of agglomerate filler in the polymer system. | |
|
Figure 2: The drilling method used for the TGA sampling. |
|
 |
 |
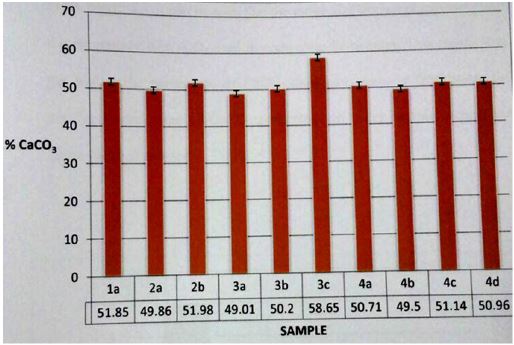 |
| Figure 3: TGA results for 10% loading of CaCO3 in polyester. | Figure 4: TGA results for 30% loading of CaCO3 in polyester. | Figure 5: TGA results for 50% loading of CaCO3 in polyester. |